When we want to use data science to work for IIoT, we typically want to either predict a failure or a quality, find the root cause of a failure or are just looking for anomalies (which in turn help us to find a root cause). For the most of these approaches, we can use predictors like regressions, decision trees, neural network. So we talk about supervised learning. For a supervised learning (no matter what algorithm), what we need is a labled set of data, that typically looks like this:
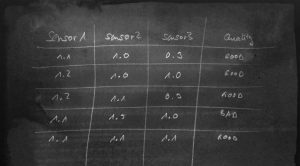
It is a list of features (in this example our raw sensor reading) and a label (here the “quality”). Then, we can load the data into the learner algorithm, train a neural network. This approach is good for the well known house credit example, where properties of people are matches to the trust and credibility, but it doesn’t easily work for industrial data, which is typically a time series of readings like this:
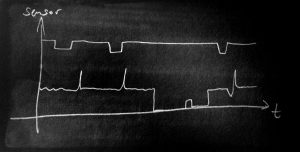
Now this is something totally different. But that’s the reality of manufacturing data. The data read from PLCs, Busses and Sensors is time-series and has another important aspect: During the run of the production (which is often 24/7), the machine is not always in full operation. There are downtimes due to maintenance, setup and machine. So, how can we convert the time series data in to a table to use the tools we know? Two steps are needed: The segmentation of the time series data plus the labeling and then the convertion (better: the feature engineering) to make a table out of the time series data. Let’s look at the first step: The time series data must be segmented into areas which make sense. Typically, these are the operation states of the manufacturing like “maintenance”, “normal production of recipe x”, “warm up phase” and so on. The next image shows an example:
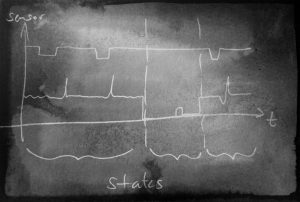
the time series data is segmented into different areas. With the areas, we can then build process chains and do process mining, we can derive the tables for predictors and much more. We also need the segmentation for anomaly detectors. There are some companies around which claim to have very clever “secret sauce” anomaly detectors (mostly for univarivate data), but without some labelling, those algorithms will try to learn also things that happen during downtime, and that can very negatively influence the learning of other areas. Time series segmentation can also be called time series classification, so we can look up the literature how to do that. In following posts, I will show how segmentation can be done with various well known tools like k-Means, decision trees and others, but for this post I want to elaborate on the topic time series segmentation a little more.
Let’s look at three ways to segment the time series
- use a classifier trained with labeled data
- use a clusterer and interactively work through the time series
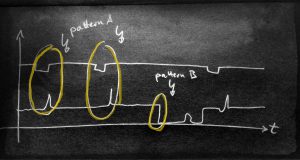
- segment the time series with pattern search
Each of those has it’s pros and cons. For 1) we need nicely labeled data for the learning phase. This can be done by annotation with experts. For 2) we don’t need labels, so we can start clustering right away. Still, an expert is needed to evaluate the cluster results and correct them by hierarchical re-clustering and merging. For 3) we need annotations of patterns plus we need the understanding that we can derive the system state just from events or a sequence of event (which might in fact be possible).
For now, let’s assume we have segmented the time series and have build a robust scorer that cuts areas from our data. Then we have build a great foundation for the next step. We can e.g. now create a table by (in the simples version of it) take the raw data of a “normal production state”, label them with the quality outcome and thus predict quality in the future. Without the previous segmentation, we can’t know which data to put on the table and would include maintenance and other times into predictors, fatally biasing the learning phase.