In this post, we want to look at using k-Means to segment a multivariate time series. We consider the vector of the scalar values of the variables sampled at the same time as the system vector. The clustering will be executed in the feature space spanned by the variables; e.g. each variable provides one dimension in that space. The time series data is a trajectory in that space. We are not looking for similarities over time in the sense of pattern mining, but want to segment the time series to find the system state of the machine. We look for clusters in the feature space spanned by the sensors to separate state. Doing so, we assume that the system states we are looking for can be well separated in that space. This is an intuitive approach as we assume that during states like normal production, maintenance, setup, recipe loading etc. the variables will significantly change and will then return into previously known value ranges once entering back into a previous state.
So, let’s look at an example. The data contain approx. 100 sensors, only one is displayed which gives a good impression of the machine’s activity:
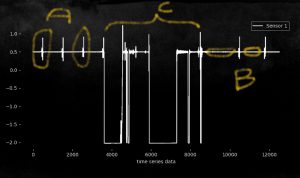
In this example, we see the plot of one sensor over time and the different system state marked as A,B,C. C is the setup of the machine and A and B are cyclic repeated system states during the normal production. The challenge is to segment the time series into A,B,C with kMeans. The advantage of using an unsupervised approach here is mainly that we don’t have to define the borders and rules when to switch between A,B,C by hand (e.g. through marking and annotating and then train a classifier). Instead, we let the system find clusters and only label them with the right state.
Let’s do that, and hopefully k-Means will be lucky to find our clusters:
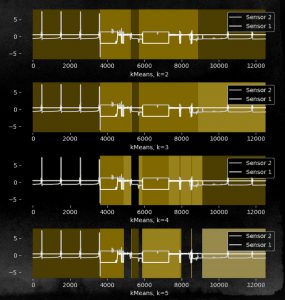
Well, unfortunately it didn’t work. Using k=2,3,4,5 did not separate the states A,B but instead clustered a lot of other stuff during the state C. The reason for this is pretty obvious: k-Means looks for clusters that are nicely separated, as it looks for minimizing the sum of distances of points to the centroids of clusters and at the same time tries to maximize the distance of the centroids between each other as a side-product. If the state vector of the machine shows much more variation during setup and maintenance than it shows during the production times and the sub-states thereof, we will have a hard time to get the clusters we look for.
One solution here is to move away from the unsupervised clustering but instead use a semi-supervised approach. We include domain and expert knowledge and
- merge clusters we want to be treated as one state
- re-cluster clusters we want to be separated into more states
We have to go through an interactive procedure where the clustering presents intermediate clustering results and we mark, merge and label those (intermediate) results. Doing so, we basically create an interactive, semi-supervised, hierarchical k-Means system. But it keeps its major advantages: The segmentation will be done by a natural separation of system states in the feature space which will – most likely – create a precise time separation between the state A,B,C.
The next picture shows the results:
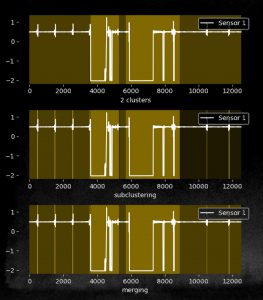
We go through 3 steps, for the first we select k=2 and can separated the state (A,B) and C pretty well. (With another state A in the C, which is probably a trial run). The we choose the cluster from the left to be re-clustered with k=3 and the the sub-clustering. Now the B-States from the left and right area (the flat sensor curve) are clustered to separate clusters. Thus, in the last step we merge them again and have nicely clustered A, B, C with minimum interaction.
Please also enjoy our whitepaper on this topic: Semi-Unsupervised Segmentation of Industrial Time Series Data