In this article I would like to share my vision on the evolution of self-service analytics. As data science and machine learning enters in nearly every business area, more and more people need to deal with new tools and possibilities. That’s why self-service came up. The idea is to bring the data closer to the user and avoid the need of the data scientist as much as possible.
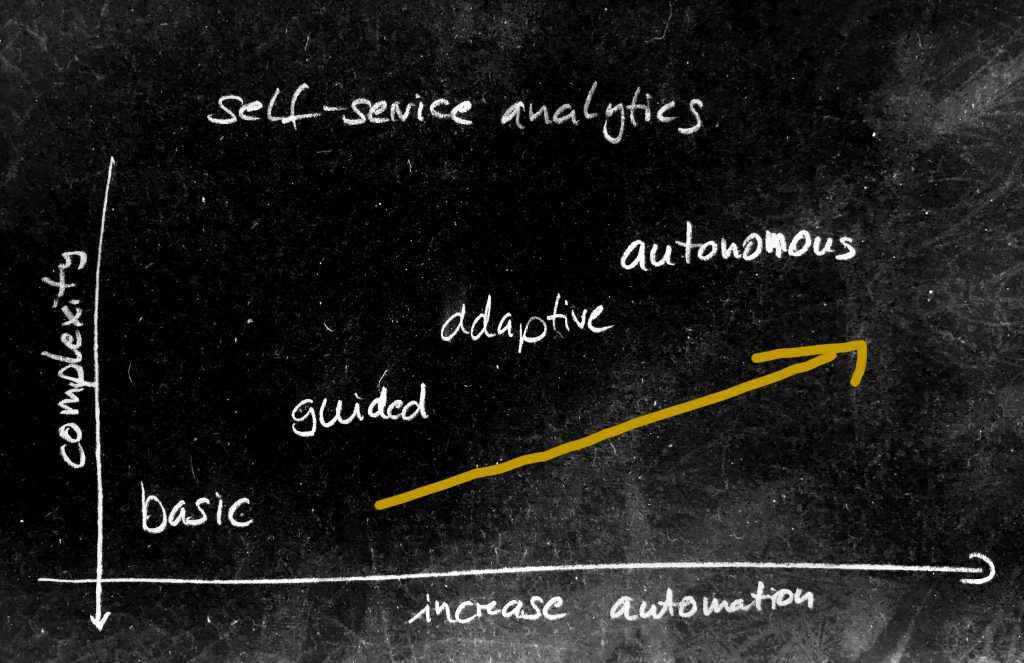
basic self-service
The user of today’s self-service system are typically so called “power users” or are data scientist. These systems are often graphical workbenches and build tools to create flows of data preparation, transformations and machine learning steps. They are built and optimized for applications that typically require one predicted value from a set of features like credit-worthiness from personal information etc. They can very well be used for prepared single-value prediction based on tabular data or to build automated dash boards and share them.
guided analytics
Guided analytics is nicely described in this article where the roles of the “user” and the “data scientist” are separated and the user takes the job of approving the results of a machine learning step with dedicated interaction points. The data science pipeline is pre-built by the data scientist. Doing so, the created system is much more than an interactive dash board. It is rather the first level of an interactive analytics for the user (which is not a data scientist)
adaptive analytics
Introducing interaction points in guided analytics in a given data science pipeline gives the user the (limited) possibility to influence the choice of algorithms or parameters. There, the user was part of the data science process. Now, in an adaptive analytics pipeline, the data science part itself is highly automated (e.g. by using tools like autoML) and adapts to the needs of the user by proposing and trying algorithms before presenting them in an interactive way to the user. All parameters of participating algorithms are automated and need no feedback by the user. User interaction is limited to results on application level.
autonomous analytics
When all parts of the data science and interaction are highly automated, we reach the area of autonomous analytics. The user just gives a meta-goal like “improve”, “find problem” and the underlying system generates and works through all necessary steps with the highest autonomy.
Simple example: System state detection
- self-service:
- engineering tool
- build a pipeline with some ETL and a classifier based on data and annotations
- user builds the pipeline itself
- guided analytics
- interactive tool for domain expert
- interactively annotate data and evaluate the results, iterate the pipeline settings
- user iterates parameters of the pipeline interactively
- adaptive analytics
- highly automated analytics
- give target areas, let the system find the best way to achieve it
- the creation and parameters of the pipeline are automated
- autonomous analytics
- highly automated analytics and UI
- tell the system to segment the data based on some information given
- pipeline generation, graphical presentation (and interaction) are fully automated