In this article I want to share practical experience on applying classification algorithms for segmenting a large data set of industrial time series data. The data set used contains approx 100 sensors sampled parallel and equidistant, so we have a good source for our machine learning experiment. We are using the vectors representing the system at one time stamp, e.g. containing one sample per sensor in its components.
The classification is used as a data preparation step to identify operation modes or system states. I will show important aspects of the practical application of data preparation such as
- normalization
- dimensionality reduction
- influence of user labelling
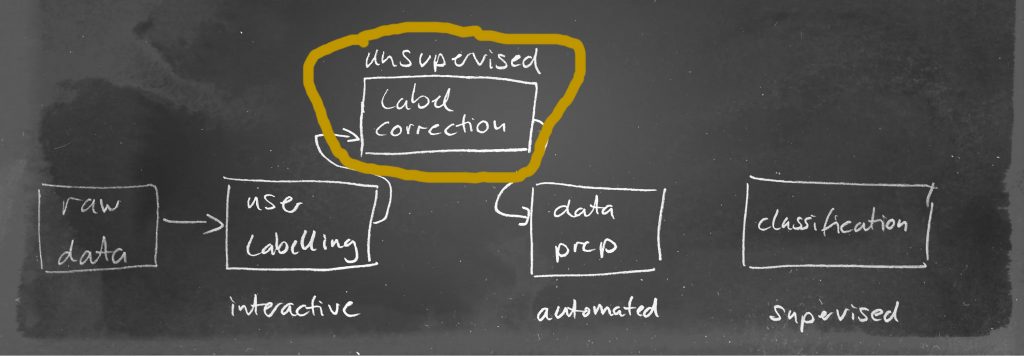
The data science processing pipeline simplified pipeline will look like:

In the context of self-service analytics – which I am most interested in – the aspect of user labelling plays an interesting role here. In a supervised learning context (like given here) it is a crucial element to have precise and correct user labels. In our use case, the user labels are created manually by the user using an interactive self-service system (like 21data:) .
So lets have a look at an area of the time-series containing two states and the labelling of the domain expert of the interesting state
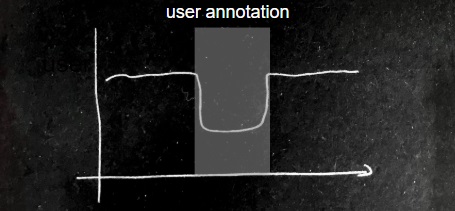
As simple as this process seams it will have a dominant influence on the outcome of any applied algorithm later. If the annotation of the user is not accurate, we will get class overlapping also called contamination. A supervised learning algorithm heavily depends on features that clearly separate one class from the other, so contaminated data for learning is a weakness in our system already in the very first step which negatively influence the quality of the trained model. So we must insert another step in our data science pipeline to adjust the user annotations by using unsupervised techniques like e.g. clustering or an isolation forest:
After applying the unsupervised correction we might identify other variables giving us a more precise point in time:
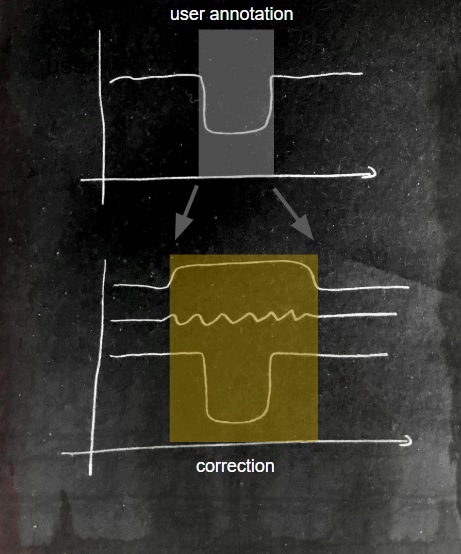
This illustration is an example on how such a correction could look like. In practice, it depends on a lot of factors and is not so easy to be automated.
Also, have a look at our whitepaper on these topics:
Data-Preparation-and-User-Labelling-for-Time-Series-Classification.pdf